· guides · 7 min read
Using Task Manager to Identify Performance Issues in Windows
A practical, step-by-step guide to using Windows Task Manager (and companion tools) to find CPU, memory, disk, network and GPU resource hogs, troubleshoot common causes, and optimize system performance.
Why Task Manager is your first stop
Task Manager is the built-in, immediate way to see what’s consuming system resources on Windows. It combines real-time summary graphs with per-process details and quick actions (end task, open file location, set priority, etc.). For most day-to-day performance troubleshooting you can diagnose the root cause without installing extra tools. For deeper inspection you can pair Task Manager with Resource Monitor, Performance Monitor, or Sysinternals Process Explorer.
Useful background reading: Microsoft’s Task Manager overview and Resource Monitor docs are good references: Open Task Manager in Windows and Resource Monitor (resmon).
How to open Task Manager quickly
- Press Ctrl + Shift + Esc (fastest).
- Or press Ctrl + Alt + Del and choose Task Manager.
- Or right-click the taskbar and select Task Manager.
Tip: If Task Manager opens in compact view, click More details to see all tabs.
Understand the main tabs (what to look for)
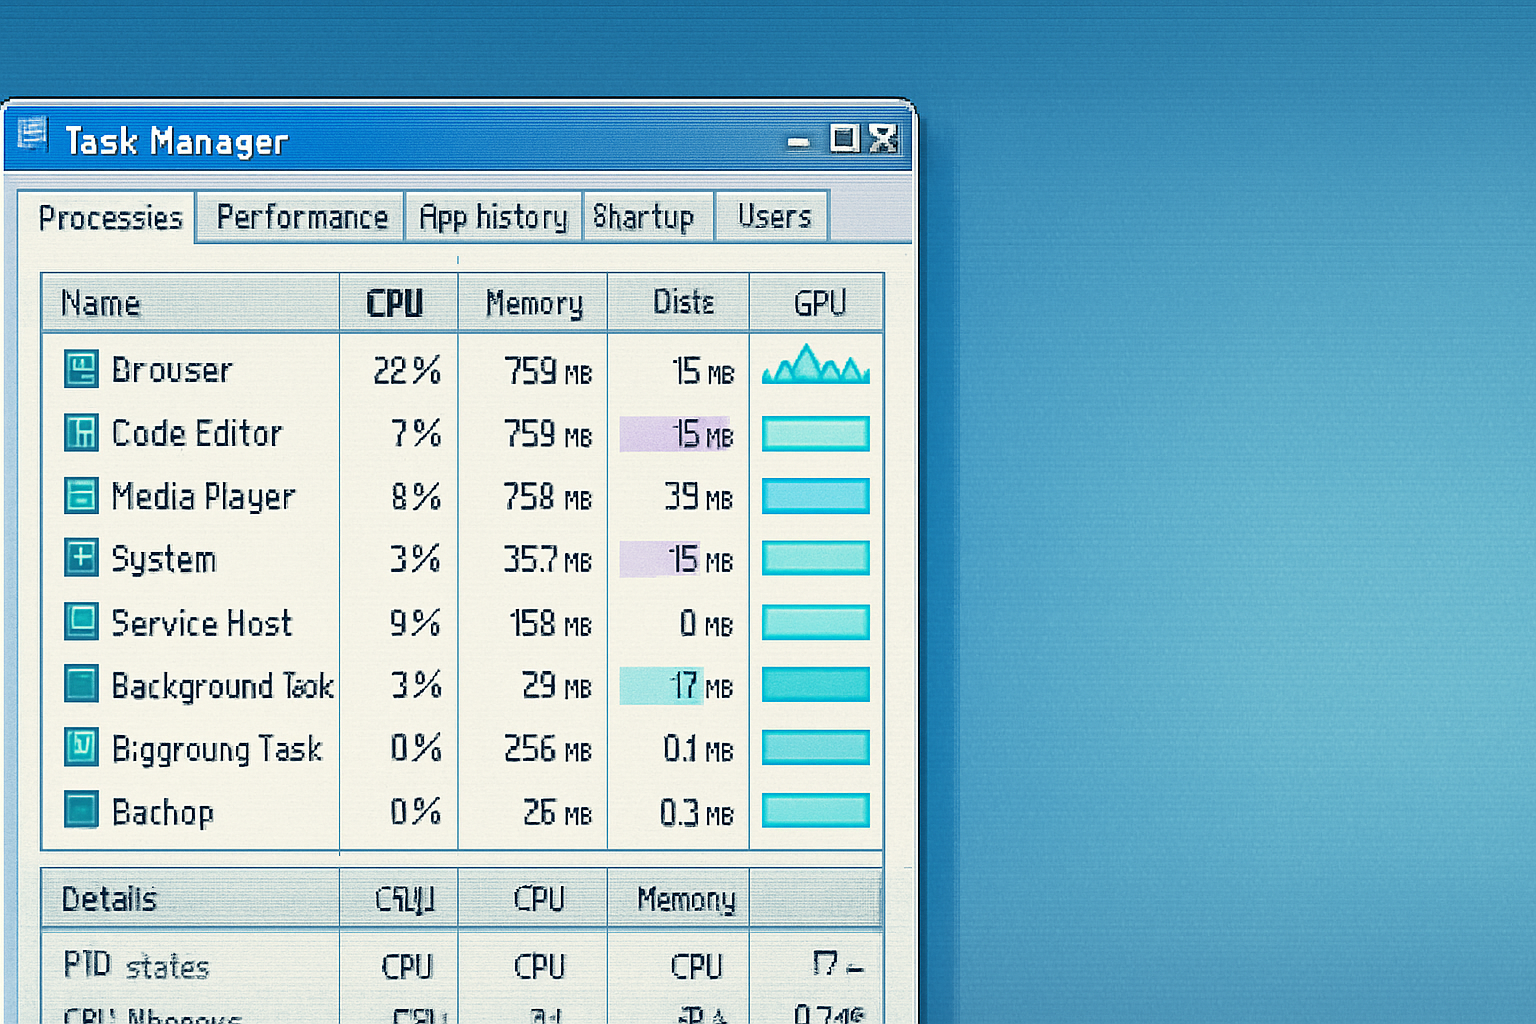
- Processes - Lists apps and background processes, with columns for CPU, Memory, Disk, Network and GPU. Good for quick triage.
- Performance - Real-time graphs for CPU, Memory, Disk, Ethernet/Wi‑Fi, and GPU. Shows total utilization and key stats (logical processors, total physical memory, speeds, etc.).
- App history - Usage metrics for Universal Windows Platform (UWP) apps over time (useful on laptops or shared machines).
- Startup - Lists programs that start with Windows, with a Startup impact rating. Disable high-impact items you don’t need at boot.
- Users - See per-user resource usage and sign out or disconnect sessions.
- Details - Low-level view showing PID, status, CPU time, memory details, and more. Use for advanced actions (set affinity/priority, create dump file).
- Services - Manage Windows services; links to open Services (
services.msc).
Newer Windows versions also offer Power usage and Power usage trend columns in Processes to spot energy-hungry apps.
Quick triage: How to find the immediate problem
- Open Task Manager > Processes.
- Click the column header (CPU, Memory, Disk, Network, GPU) to sort descending.
- Identify the top consumer(s). One process using a very high percentage is usually the culprit.
- Right-click the process for quick options: End task, Open file location, Search online, Go to details.
Quick actions:
- If a program is unresponsive or clearly misbehaving, use End task. This forcibly terminates the process - save work first.
- Use Search online to learn what a suspicious executable (e.g., unknown name) does.
- Use Open file location to check whether it’s stored in Program Files or a suspicious path.
Diagnosing specific problems
Below are focused workflows for common symptoms.
High CPU usage
Signs: CPU graph near 100% and processes with high CPU %.
Steps:
- Sort by CPU in Processes. Note the process name and PID (Details tab is useful for PID).
- If it’s an app (browser, game), consider updating or closing unnecessary tabs/extensions.
- If it’s a system process (e.g., Windows Update, Service Host), open the Details tab and then Services to identify related services.
- Use Search online for the process name to check whether it’s normal.
- If CPU usage is spiking with no obvious app - check drivers (especially GPU or storage drivers) and recent Windows updates. A buggy driver or update can cause sustained CPU work.
When to change priority/affinity:
- Setting priority higher can temporarily favor a process but can make the system less responsive; use cautiously.
- Setting affinity (bind process to certain cores) is rarely necessary except for testing.
When to create a memory dump:
- For persistent or crashing processes, right-click in Details > Create dump file and send to support or inspect with debugging tools.
High memory usage / memory leak
Signs: Memory usage high on Performance tab; one process consuming more and growing over time.
Steps:
- Sort by Memory in Processes. Note the process that’s large and check if its memory usage grows over time.
- Restarting the app may temporarily resolve a memory leak.
- If a service or driver leaks memory (nonpaged pool growth), Task Manager may not show pool details - use Resource Monitor or Performance Monitor (perfmon) for more granular counters.
- For apps - update to the latest version; check for known memory-leak issues.
Useful tools:
- Resource Monitor (open from Performance tab via “Open Resource Monitor” or run resmon.exe) shows commit, working set, and handles.
- Process Explorer from Sysinternals shows private bytes, working set, handles, and allows deeper inspection: https://docs.microsoft.com/sysinternals/downloads/process-explorer
High disk usage
Signs: Disk column near 100% or slow IO; system becomes sluggish.
Common causes: Antivirus scans, Windows Update, Superfetch/SysMain, background disk indexers, low free disk space, failing drive.
Steps:
- Sort by Disk in Processes.
- If an antivirus or Windows Update process is high, allow it to finish; schedule scans for off-hours.
- Check disk health - run chkdsk and check SMART data with third‑party tools if you suspect hardware issues.
- If the system constantly uses high disk without obvious process, check for excessive paging (Performance > Memory > Commit Size) - low RAM can force frequent pagefile access.
High network usage
Signs: Network column shows heavy activity.
Steps:
- Sort by Network in Processes.
- Right-click > Search online to identify unknown processes using network.
- For detailed per-connection info, open Resource Monitor (Network tab) to view listening ports, established connections, and which process owns them.
- Consider firewall rules if unknown outbound connections appear.
GPU-heavy processes
Signs: GPU usage or specific GPU Engine column shows activity (useful for multi-GPU systems).
Steps:
- Sort by GPU or GPU Engine in Processes.
- If a browser process uses GPU heavily, hardware acceleration in the browser might be the reason - try disabling it.
- For graphics drivers - update GPU drivers, or roll back if issues began after an update.
Startup and background processes: speed up boot
- Open Task Manager > Startup.
- Look for high-impact items or apps you don’t need at boot.
- Right-click and choose Disable for startup entries you can live without.
- For services started at boot - open Services (link from Services tab) or use msconfig for legacy control.
Tip: Some apps will re-add startup entries unless you opt out in their settings; disable from the app itself when possible.
Services and the Details tab: lower-level control
- Use Services tab to identify and restart services. Right-click a service and choose Go to details to find the underlying process.
- In Details, you can see PID, CPU time, and more. Right-click to set priority or affinity, create a dump, or open file location. This is where you take careful actions when a service is misbehaving.
Warning: Killing or changing system services can destabilize Windows. Only change critical settings when you understand the impact.
Advanced tools when Task Manager isn’t enough
- Resource Monitor (resmon.exe) - shows per-process disk reads/writes, network connections and ports, and more granular memory details: https://learn.microsoft.com/windows-server/administration/windows-commands/resmon
- Performance Monitor (perfmon) - set up counters to track trends over time and collect logs for later analysis.
- Process Explorer (Sysinternals) - replaces Task Manager for deep analysis - shows stacks, handles, loaded DLLs and allows killing processes that are stubborn:
Example troubleshooting workflows
Symptom - System feels sluggish intermittently.
- Open Task Manager > Performance to verify spikes.
- When sluggish, open Processes and sort by CPU/Disk/Memory.
- If nothing obvious, open Resource Monitor to watch disk IO and network.
- If system RAM is near full, consider closing apps or adding RAM.
Symptom - Browser consumes 90% CPU.
- Identify the browser process in Task Manager.
- Use the browser’s Task Manager (e.g., Chrome - Shift+Esc) to find the offending tab/extension.
- Update or disable extensions, clear cache, or create a fresh profile.
Symptom - Background process causing 100% disk.
- Check Processes > Disk.
- If antivirus or Windows Update, allow completion or reschedule.
- If unknown, open Resource Monitor > Disk to see the exact files being accessed.
Best practices and preventive tips
- Keep Windows and drivers up to date, but be cautious - some updates can introduce regressions - keep restore points.
- Keep sufficient free disk space (a low free disk can cause heavy paging and sluggishness).
- Run occasional malware scans; unexpected resource usage can be malware.
- Limit startup apps and background utilities you don’t need.
- Use Task Manager’s Efficiency mode (where available) on power-constrained devices to reduce resource priority for nonessential apps.
When to seek help / collect diagnostics
- Create memory/process dumps (Details > Create dump file) when an app repeatedly crashes or consumes resources abnormally, then share with support.
- Use Performance Monitor to collect logs over time for intermittent issues.
- For complex or kernel-level problems (driver bugs, hangs), gather system logs (Event Viewer) and consider expert tools like WinDbg.
Microsoft troubleshooting docs and Sysinternals are excellent next steps: Process Explorer and Resource Monitor.
Summary
Task Manager is an immediate and powerful first step to identify resource hogs and understand what’s affecting system performance. Start with the Processes and Performance tabs for quick triage, use Startup and Services to control what runs, and escalate to Resource Monitor, Performance Monitor, or Process Explorer when you need deeper insight. Combine these tools with sensible maintenance (updates, drivers, cleanup and scans) and you’ll resolve most performance issues quickly.