· guides · 6 min read
Comparing the Best Free PC Diagnostic Tools: A Comprehensive Review
An in-depth comparison of the top free PC diagnostic utilities - what they test, how accurate and easy they are, and which to pick for troubleshooting CPU/GPU, memory, storage, crashes, and performance issues.
Why you need dedicated diagnostic tools
When a PC is unstable, slow, or intermittently failing, the first step is to diagnose the root cause. Windows has built-in tools, but specialized free utilities provide deeper visibility into hardware sensors, S.M.A.R.T. data, memory integrity, crash dumps, and running processes. This guide compares the most popular free PC diagnostic tools, evaluates their features, usability, and effectiveness, and gives clear recommendations for common troubleshooting scenarios.
How I compare tools (methodology)
I evaluate each tool across these practical criteria:
- Feature set - what it inspects (CPU, GPU, RAM, disk S.M.A.R.T., temps, voltages, logs)
- Accuracy & depth - sensor detail, S.M.A.R.T. interpretation, memory stress coverage
- Usability - installation, interface, clarity for non-experts
- Portability & safety - portable builds, offline use, read-only vs destructive
- Resource usage & reliability - CPU/memory footprint while running
- Platform & support - Windows compatibility and documentation/community
Tools cited here are tested on modern Windows systems and are linked to official pages for download and details.
Quick comparison (at a glance)
| Purpose | Best free tool(s) | Notes |
|---|---|---|
| Hardware overview (CPU/GPU/board) | HWiNFO, CPU-Z, GPU-Z | HWiNFO is the most comprehensive; CPU-Z and GPU-Z are lightweight and focused |
| Sensor monitoring (temps/voltages/fans) | HWMonitor, HWiNFO | HWiNFO offers detailed logging and customizable alerts |
| Disk health (S.M.A.R.T.) | CrystalDiskInfo | Clear S.M.A.R.T. status; supports NVMe and SSDs |
| Disk benchmarking | CrystalDiskMark | Simple read/write throughput tests |
| Memory testing | MemTest86, Windows Memory Diagnostic | MemTest86 (bootable) is more thorough than Windows built-in tool |
| Crash/dump analysis | BlueScreenView, WhoCrashed | Easy summaries of minidumps and suspected drivers |
| Process-level troubleshooting | Process Explorer, Autoruns | Deep inspect of handles, DLLs, and startup entries |
| Vendor-specific SSD tools | Samsung Magician, SeaTools | Use vendor tools for firmware updates and vendor-specific tests |
Detailed tool reviews
HWiNFO (best all-around hardware info & monitoring)
- Official: https://www.hwinfo.com
- What it does - exhaustive hardware inventory, real-time sensor monitoring, logging, and sensor alerting.
- Pros - extremely detailed sensor/board-level data, logging and CSV export, supports laptops, desktops, and servers.
- Cons - information density can overwhelm beginners; many options to sift through.
- Best for - tech-savvy users and IT pros who need complete hardware telemetry and logging.
CPU-Z and GPU-Z (quick component ID)
- CPU-Z: https://www.cpuid.com/softwares/cpu-z.html
- GPU-Z: https://www.techpowerup.com/gpuz/
- What they do - provide quick, reliable identification of CPU/GPU model, speeds, cache, and core clock/temperature.
- Pros - tiny, portable, ideal for verifying CPU/GPU specs.
- Cons - not a monitoring/logging platform.
- Best for - verifying specs before BIOS updates or driver troubleshooting.
HWMonitor (lightweight sensor monitor)
- Official: https://www.cpuid.com/softwares/hwmonitor.html
- What it does - shows temps, voltages, fan speeds, and power draw in a simple list.
- Pros - easy to read; low overhead.
- Cons - less configurable than HWiNFO; fewer logging features in free version.
CrystalDiskInfo & CrystalDiskMark (disk health & speed)
- Official: https://crystalmark.info/en/software/crystaldiskinfo/ and https://crystalmark.info/en/software/crystaldiskmark/
- What they do - CrystalDiskInfo reports S.M.A.R.T. attributes and drive health; CrystalDiskMark benchmarks sequential and random read/write throughput.
- Pros - CrystalDiskInfo gives a quick health status (Good/Caution/Bad) and detailed attributes like reallocated sectors and wear leveling.
- Cons - S.M.A.R.T. can miss some impending failures; combine with vendor tools and backups.
- Best for - verifying SSD/HDD health and testing throughput to spot underperforming drives.
MemTest86 and Windows Memory Diagnostic (RAM testing)
- MemTest86: https://www.memtest86.com/
- Windows Memory Diagnostic: https://support.microsoft.com
- What they do - boot-time RAM stress tests to detect faulty memory cells and errors.
- Pros - MemTest86 is very thorough (multiple test patterns) and boots from USB; Windows Memory Diagnostic is convenient and built-in.
- Cons - MemTest86 can take many hours depending on RAM size and passes; Windows tool is less exhaustive.
- Best for - diagnosing random freezes, BSODs, and data corruption suspected to be memory-related.
BlueScreenView & WhoCrashed (analyze crash dumps)
- BlueScreenView: https://www.nirsoft.net/utils/blue_screen_view.html
- WhoCrashed: https://www.resplendence.com/whocrashed
- What they do - parse minidump files after BSODs and highlight likely faulting drivers.
- Pros - quick, beginner-friendly summaries and links to implicated drivers.
- Cons - they suggest likely culprits but not always definitive - use in combination with driver/BIOS updates and further tests.
- Best for - triaging crash dumps and identifying driver or module names to investigate.
Process Explorer & Autoruns (processes and startup)
- Process Explorer: https://learn.microsoft.com/en-us/sysinternals/downloads/process-explorer
- Autoruns: https://learn.microsoft.com/en-us/sysinternals/downloads/autoruns
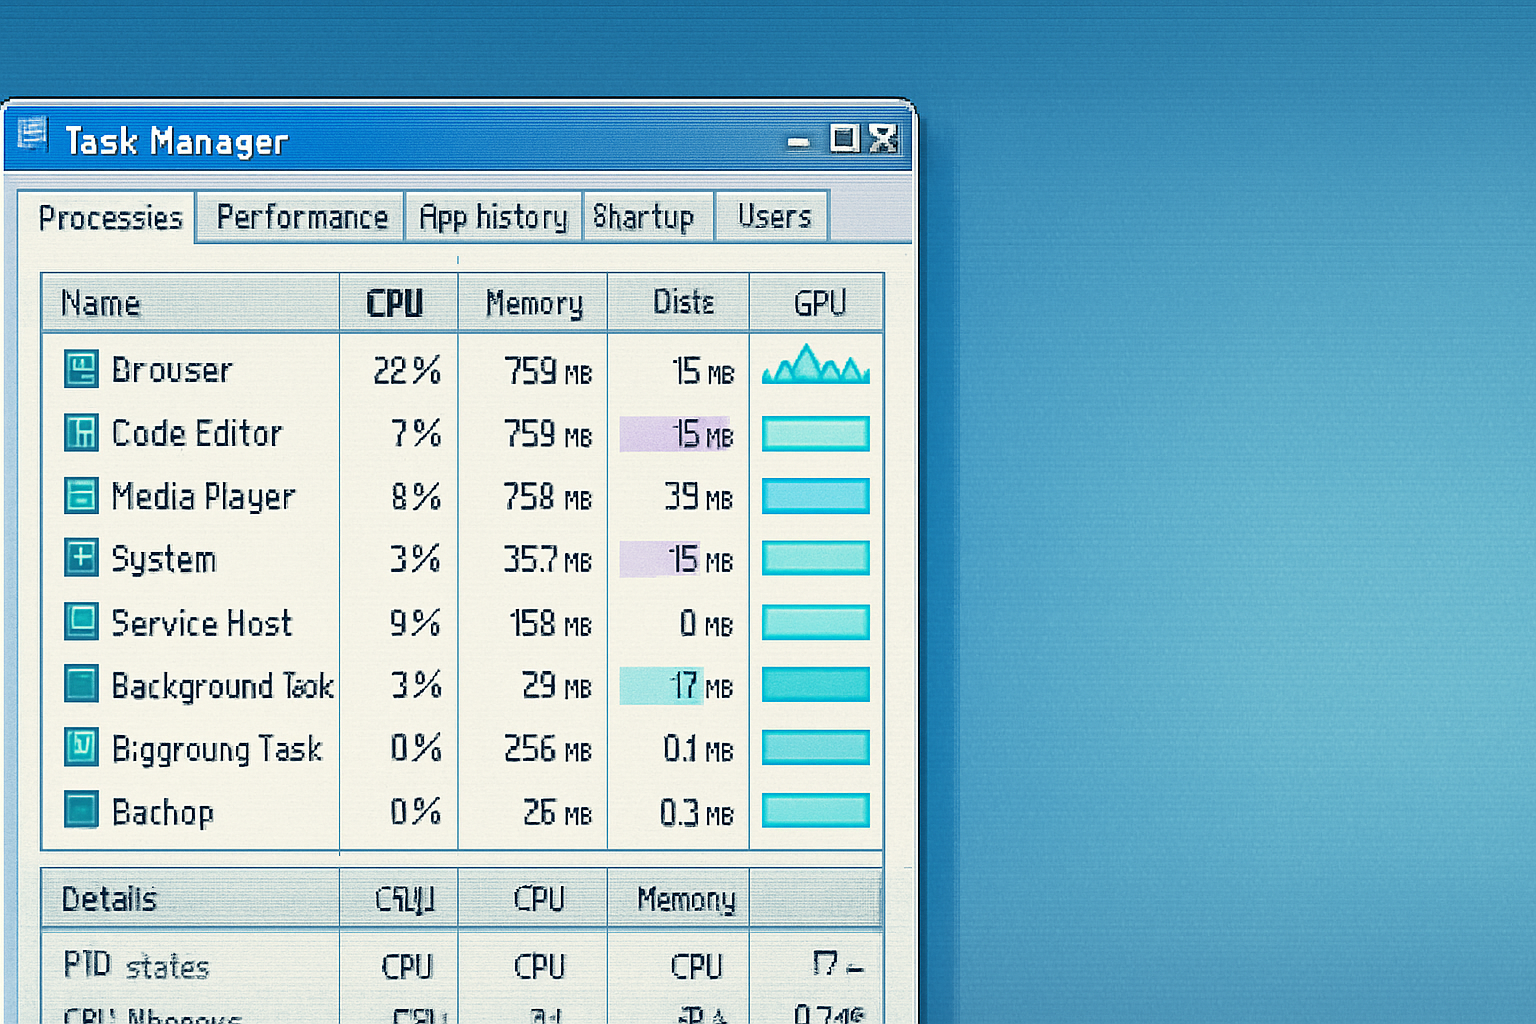
- What they do - Process Explorer replaces Task Manager for deep inspection (handles, loaded DLLs, GPU usage); Autoruns shows all startup points.
- Pros - essential for finding runaway processes, hidden drivers, or malware persistence.
- Cons - can expose many low-level entries that require expertise to interpret.
- Best for - security-savvy users and technicians tracking down resource hogs or malicious startup entries.
Vendor SSD utilities (Samsung Magician, SeaTools)
- Samsung Magician: https://www.samsung.com/semiconductor/minisite/ssd/download/tools/
- SeaTools: https://www.seagate.com/support/downloads/seatools/
- What they do - manufacturer-specific tools for firmware updates, health checks, secure erase, and proprietary benchmarks.
- Pros - best for firmware updates and vendor-specific diagnostics; some tools can fix or refresh SSD firmware.
- Cons - only for the vendor’s hardware; make sure to back up before firmware updates.
- Best for - Samsung/Seagate drive owners who need firmware and advanced SSD management.
Practical how-to snippets (common tasks)
Check disk health quickly - Install and run
Run a thorough memory test - Download
Inspect temperature and voltages - Open
Investigate BSODs - Use
Find runaway apps - Run
Practical recommendations (which tool for which scenario)
- Beginner who wants a single easy app - HWiNFO (Sensor-only mode) + CrystalDiskInfo.
- Suspected RAM fault - MemTest86 (bootable) - perform multiple passes.
- Drive health and simple benchmarking - CrystalDiskInfo + CrystalDiskMark.
- BSODs and driver faults - BlueScreenView + WhoCrashed to triage dumps, then Process Explorer to hunt processes.
- Deep hardware logging for intermittent issues - HWiNFO with CSV logging.
Caveats and best practices
- Always backup before running disk-level fixes or firmware updates.
- S.M.A.R.T. is useful but not infallible - some drives fail without prior S.M.A.R.T. warnings, while others show warnings long before failure.
- Run memory tests with single-channel and stock timings first; try re-seating RAM and testing modules individually.
- Use portable builds where available to avoid installation issues and to run diagnostics on different machines.
- Keep driver and BIOS/UEFI firmware up to date when troubleshooting - but update carefully (and with backups) when diagnosing critical failures.
Final verdict
There is no single “best” free diagnostic tool because different tools specialize in different domains. For most users the best approach is a small toolkit:
- HWiNFO (monitoring & logging) + CPU-Z/GPU-Z (quick ID) + CrystalDiskInfo (drive health) + MemTest86 (memory) + Process Explorer/Autoruns (process/startup) + BlueScreenView/WhoCrashed (crash analysis).
Taken together, these free utilities cover hardware inventory, sensors, storage health, memory integrity, and crash/process-level troubleshooting - the key areas to isolate most PC problems quickly and effectively.
References and download pages
- HWiNFO: https://www.hwinfo.com
- CPU-Z: https://www.cpuid.com/softwares/cpu-z.html
- GPU-Z: https://www.techpowerup.com/gpuz/
- HWMonitor: https://www.cpuid.com/softwares/hwmonitor.html
- CrystalDiskInfo & CrystalDiskMark: https://crystalmark.info/en/
- MemTest86: https://www.memtest86.com/
- Windows Memory Diagnostic: https://support.microsoft.com
- BlueScreenView: https://www.nirsoft.net/utils/blue_screen_view.html
- WhoCrashed: https://www.resplendence.com/whocrashed
- Process Explorer & Autoruns (Sysinternals): https://learn.microsoft.com/en-us/sysinternals/
- Samsung Magician: https://www.samsung.com/semiconductor/minisite/ssd/download/tools/
- SeaTools (Seagate): https://www.seagate.com/support/downloads/seatools/
(Links point to official vendor and project pages for downloads and documentation.)
